
Donald Trump’s re-election is set to bring substantial shifts in US economic policy, with significant implications for the USD. His administration’s priorities, including tax reforms, deregulation, and assertive trade policies, are expected to influence the dollar’s trajectory. Initial market reactions indicate a stronger USD against major currencies, driven by investor confidence in pro-growth policies. However, as the fiscal landscape evolves, potential inflationary pressures and trade tensions could create volatility. This article explores these dynamics, breaking down the key economic indicators, immediate impacts on financial markets, and strategies for traders to navigate the USD in this new term.
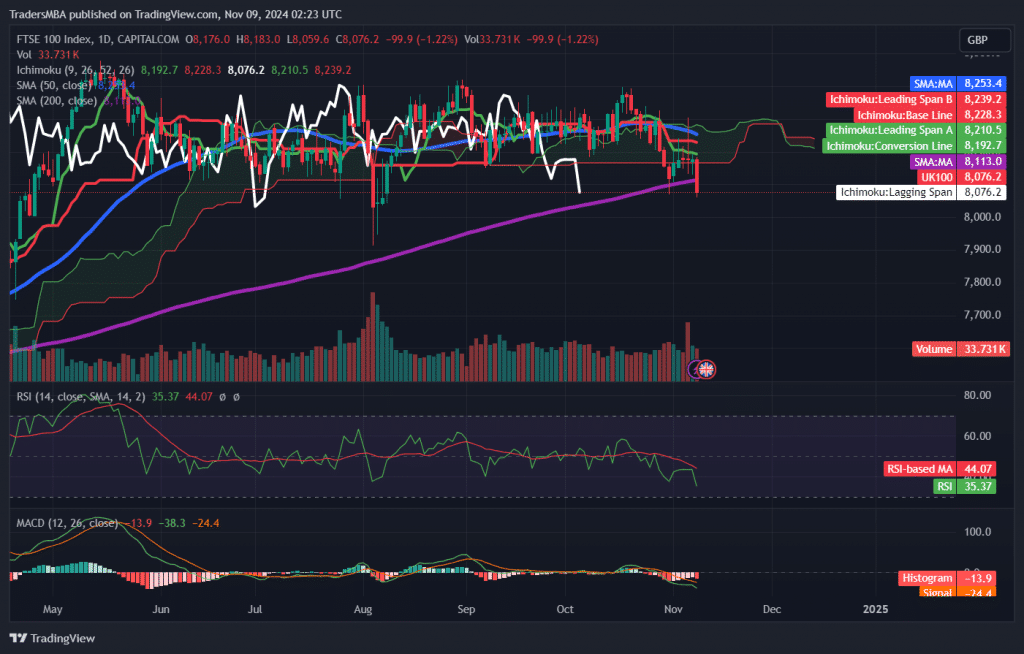
The FTSE 100 faces downward pressure as inflation and interest rate concerns weigh on UK stocks. A break below support levels could signal further downside, with economic uncertainties dampening investor sentiment.
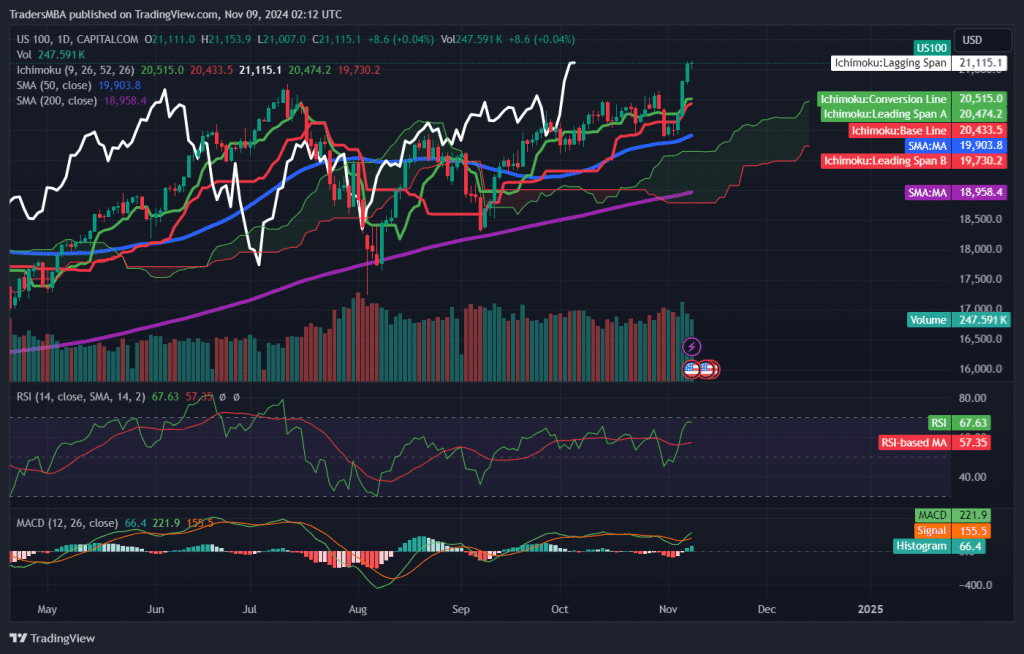
The US100 index is showing strong bullish momentum, driven by robust earnings from major tech companies and a stable economic outlook. With the Federal Reserve signalling a pause in rate hikes, investor sentiment remains positive. Key technical indicators, such as moving averages and the Ichimoku Cloud, confirm the uptrend. Traders may consider a long position with a target of 21,500, supported by favourable macroeconomic and sentiment factors.

Gold is showing signs of a bearish reversal amid dollar strength and Fed hawkishness. With RSI in overbought territory and weakening buying volume, short-term downside is likely.

WBD is approaching a significant resistance level on its daily chart, with indicators suggesting potential for a breakout. With bullish signals from the Ichimoku Cloud, moving averages, and MACD, WBD’s near-term outlook is positive, but overbought RSI and fundamental debt concerns warrant a balanced approach.

Plug Power (PLUG) shows signs of a potential bullish reversal as indicators like RSI and MACD point to a momentum shift. Key resistance at the 200-day SMA ($2.75) will be crucial for a sustained breakout.

Technical indicators for Lithium Americas Corp. (LAC) suggest a bullish trend, with the RSI approaching overbought levels, moving averages providing support, and increased volume confirming momentum.
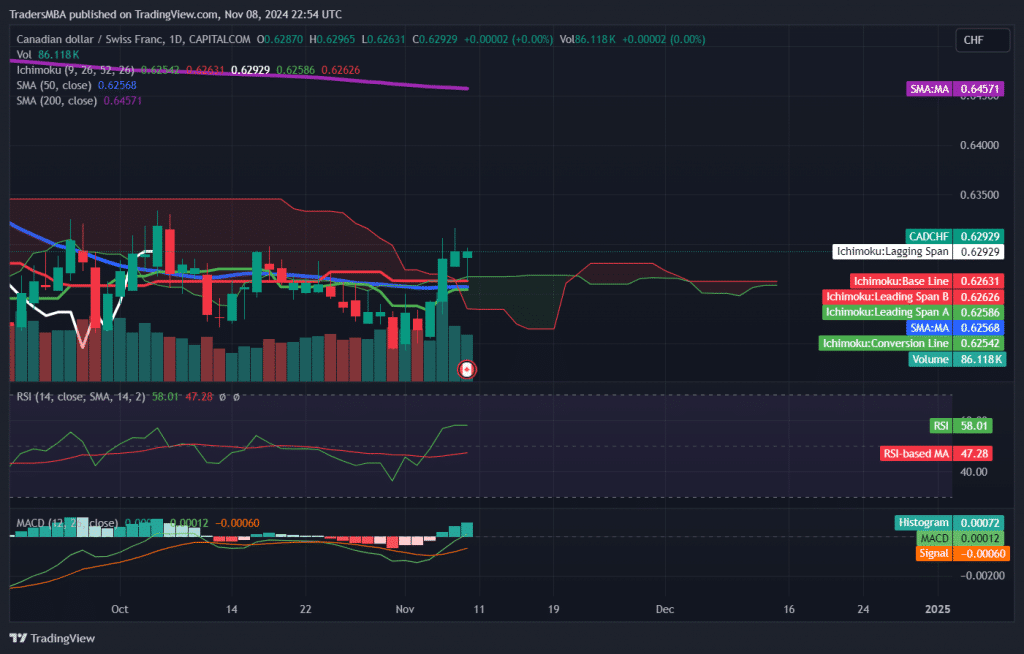
CAD/CHF displays a bullish setup on the daily chart, bolstered by Canada’s strong economic fundamentals and the SNB’s dovish policy. With CAD supported by moderate GDP growth and robust inflation management, the pair could see further gains if resistance at 0.6300 is breached.

The re-election of Donald Trump promises to shape the U.S. stock market, with anticipated tax cuts, deregulation, and infrastructure investments expected to boost sectors like energy, financials, and industrials. However, trade tensions and geopolitical strategies may introduce market volatility, particularly for globally exposed companies. This article explores the opportunities and risks for investors as Trump’s policies take hold over the next four years.

CHF/JPY bears dominate as economic divergence and technical patterns signal potential downside. Key resistance at 176 and 200-day SMA support at 171.9 guide traders on this likely bearish path.
