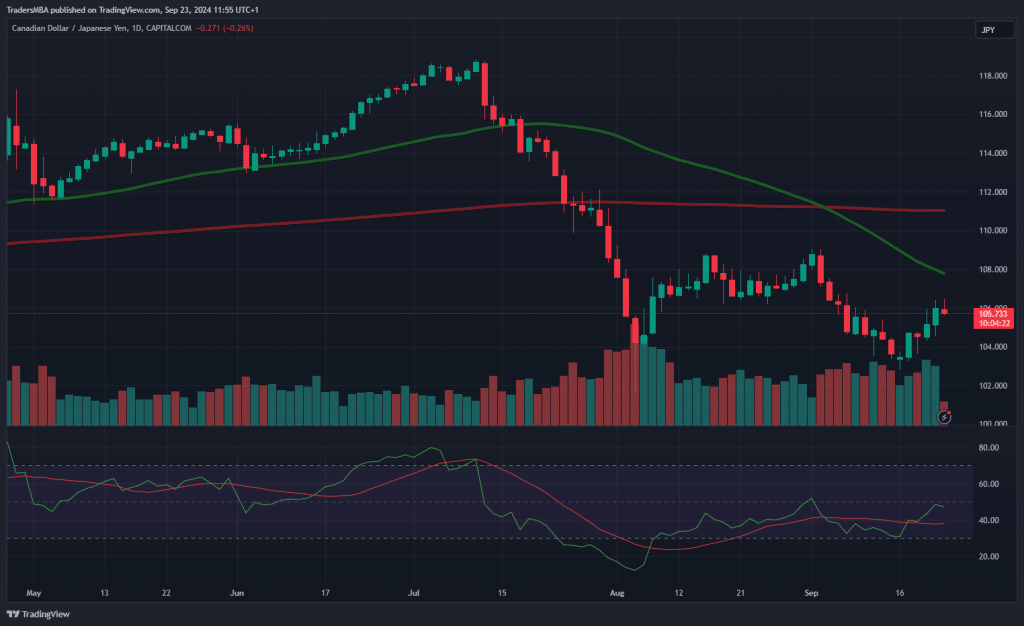
The CAD/JPY pair is under pressure due to diverging economic conditions between Canada and Japan. Technical analysis confirms a bearish trend, with key support at 103.50. Traders should watch upcoming economic data for further clues on direction.
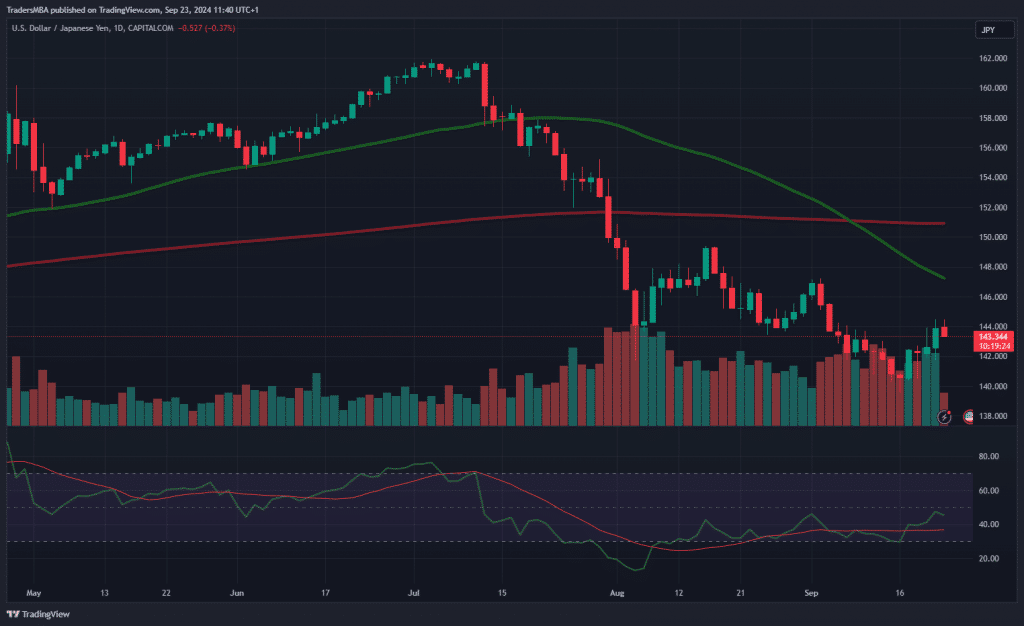
USD/JPY is under pressure as diverging monetary policies between the Fed and BoJ drive bearish sentiment. Key technical levels and economic indicators suggest potential downside towards 140. Stay updated with our analysis for actionable insights.

The GBP/JPY pair is navigating a complex macroeconomic environment, with contrasting monetary policies between the BoE and BoJ creating volatile market conditions. Key support and resistance levels are in focus as traders weigh the impact of interest rate differentials and economic data on future price movements.
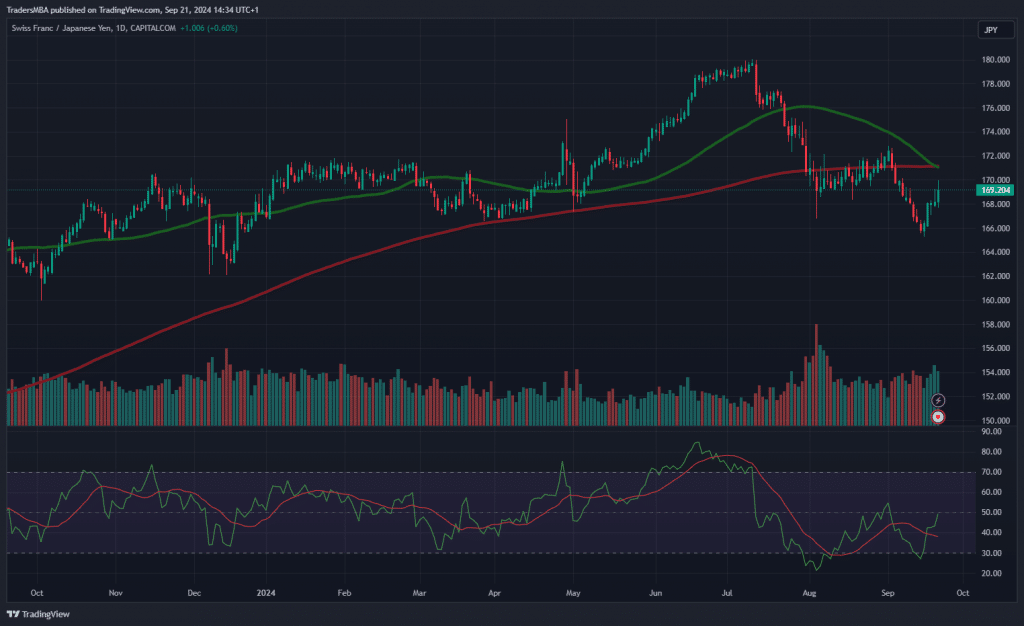
CHF/JPY shows a bullish trend supported by Switzerland’s robust economic performance and the SNB’s hawkish stance. The pair is likely to appreciate further amid BoJ’s continued dovishness. Key levels to watch are 168.00 (support) and 172.00 (resistance), with a potential target of 174.00 by year-end.
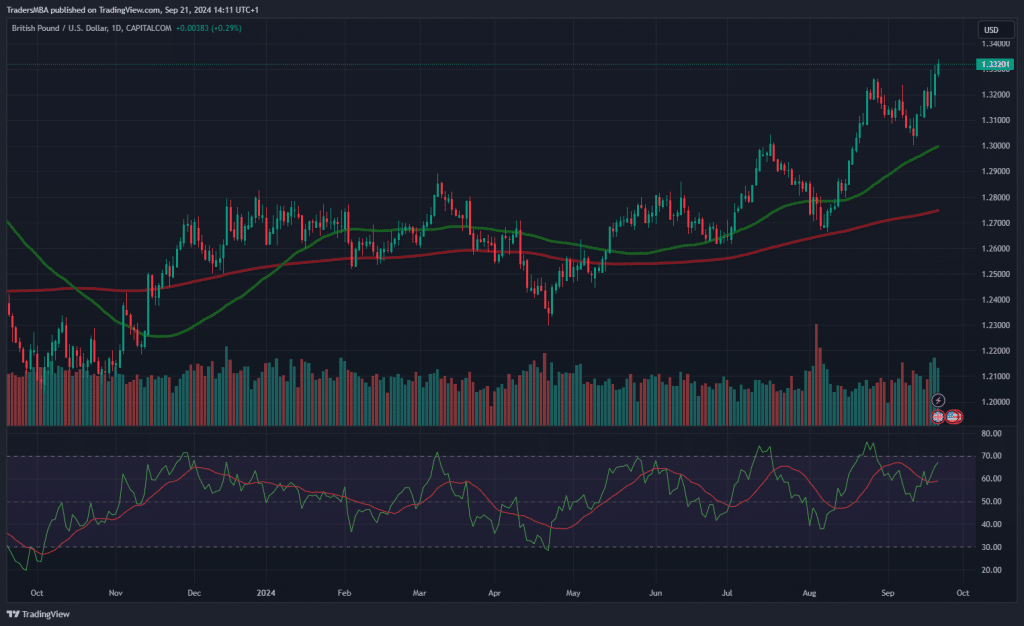
The GBP/USD pair has broken above 1.3300, driven by the BoE’s hawkish stance against the Fed’s dovish pause. With key economic data supporting the bullish trend, the outlook remains positive. Traders should watch for potential pullbacks as RSI approaches overbought levels.

The EUR/USD pair is showing strong bullish momentum due to the widening interest rate differential between the Fed and ECB. With a favourable technical setup and positive sentiment, the pair is poised for further gains towards 1.1280. Stay updated with the latest market analysis and make informed trading decisions.

Lithium Americas Corp. (LAC) is currently in a consolidation phase as investors await clearer signals on future price action. The stock faces resistance at $3.10, with technical and sentiment analysis suggesting a neutral outlook in the near term. Key levels to watch include $2.00 for support and $3.50 for potential upside.
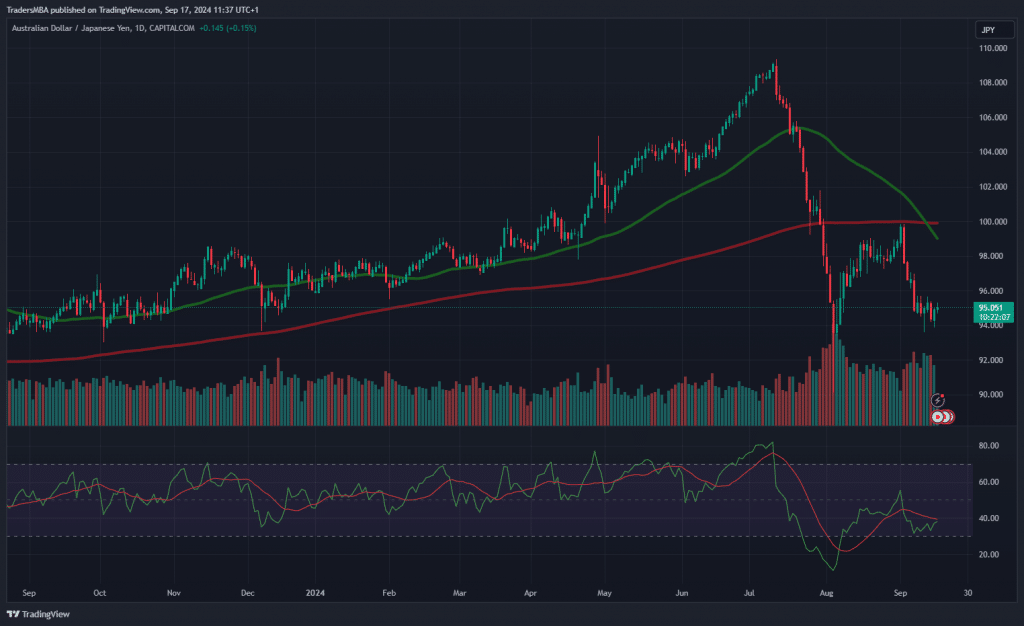
AUD/JPY is under bearish pressure as risk sentiment fades and interest rate differentials weigh heavily on the pair. With key support at 93.00 and resistance at 95.50, the market outlook leans towards further downside, especially if global economic conditions worsen. Sentiment and technical indicators suggest the pair may test lower levels, presenting an opportunity for short positions.

Intel’s stock is showing signs of recovery, driven by strategic investments and improving market sentiment. With a favourable risk-reward ratio and undervalued metrics like the P/B ratio, Intel presents a potential opportunity for medium- to long-term investors. Key levels to watch include $22 as resistance and $18 as support.
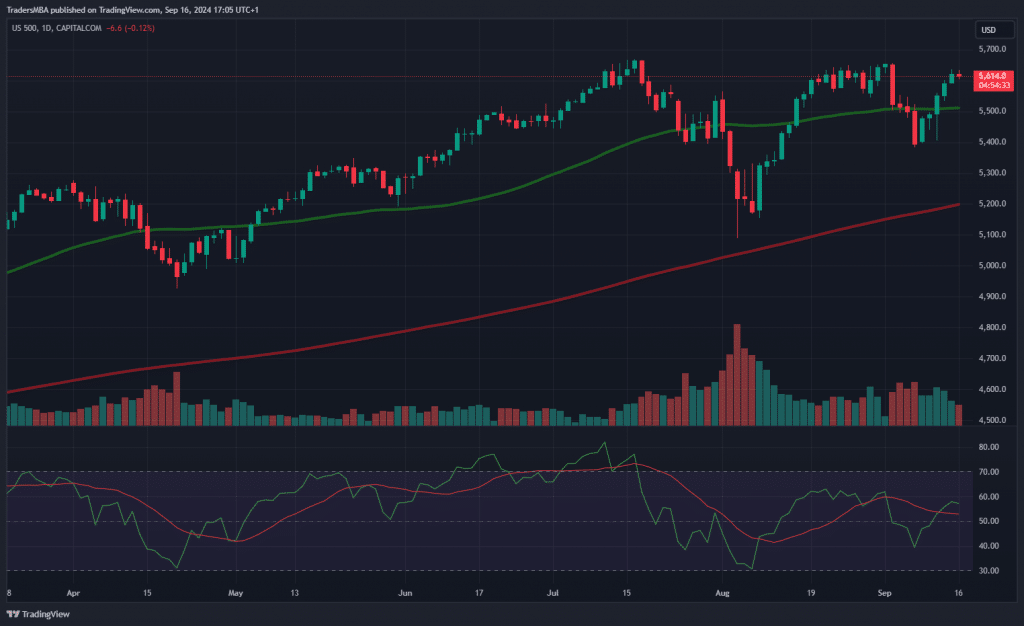
Introduction As of mid-September 2024, the US stock market, represented by the S&P 500, remains a key focal point for investors assessing the risk of a potential market correction. A market correction is defined as a drop of 10% or more from recent highs, and this possibility has become a concern amid high valuations, economic uncertainty, and fluctuating monetary policy. The attached chart of the S&P 500 (US500) as of……
Read more
