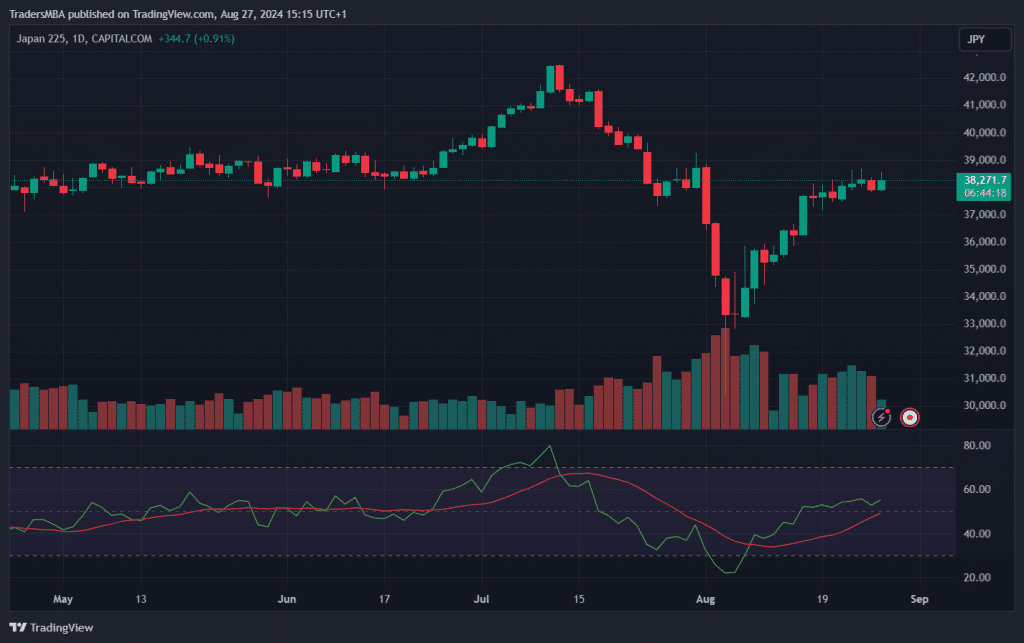
The Japan 225 index is exhibiting signs of potential bullish momentum, with RSI levels indicating further upside potential and volume supporting recent price rebounds. Key economic data and upcoming earnings reports could provide catalysts for movement, especially as the market watches for any shifts in Bank of Japan policy.
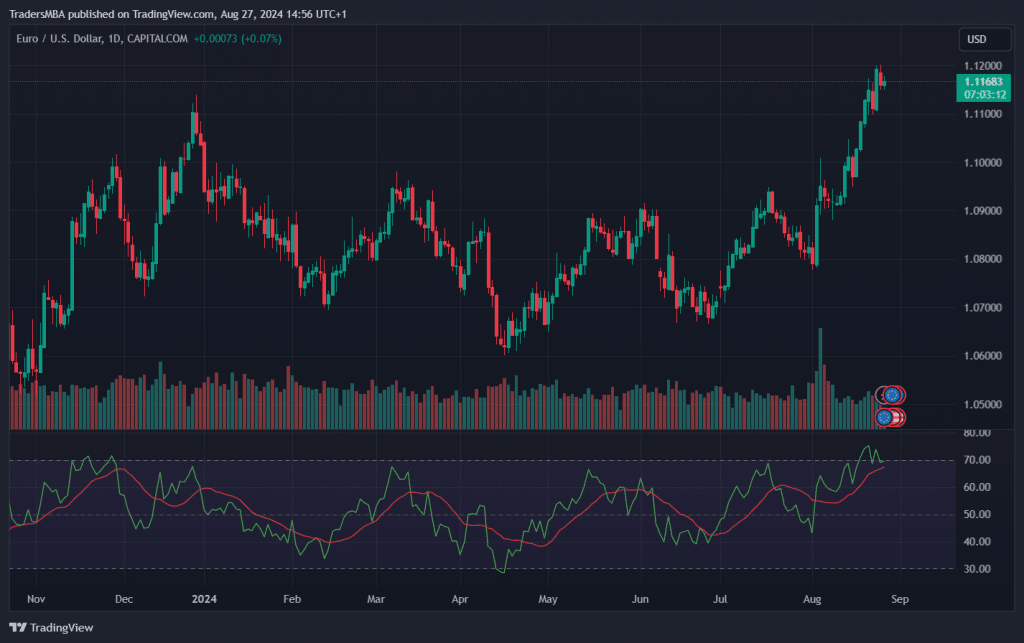
The EUR/USD has shown strong bullish momentum recently, approaching a critical resistance level at 1.1200. Despite overbought RSI conditions, the trend is supported by increasing trading volumes. Upcoming Eurozone inflation data and key central bank meetings could provide further direction for the pair. Traders should watch for a potential pullback before any continuation of the uptrend.

Technical Analysis Candlestick Patterns and Chart Patterns Price Action (Support and Resistance Levels) RSI (Relative Strength Index) Volume Analysis Fundamental Analysis Upcoming Macroeconomic Data Economic Calendar Events Earnings Calendar Analysis Sentiment Analysis Conclusion and Trading Recommendation

The US 100 Index is currently showing strong bullish momentum supported by rising volume and positive sentiment around upcoming earnings and macroeconomic data. Technical indicators suggest further upside potential, with resistance levels around 20,000 and 21,000 in focus. Traders should monitor economic data releases and Federal Reserve announcements closely, as they could impact market direction.
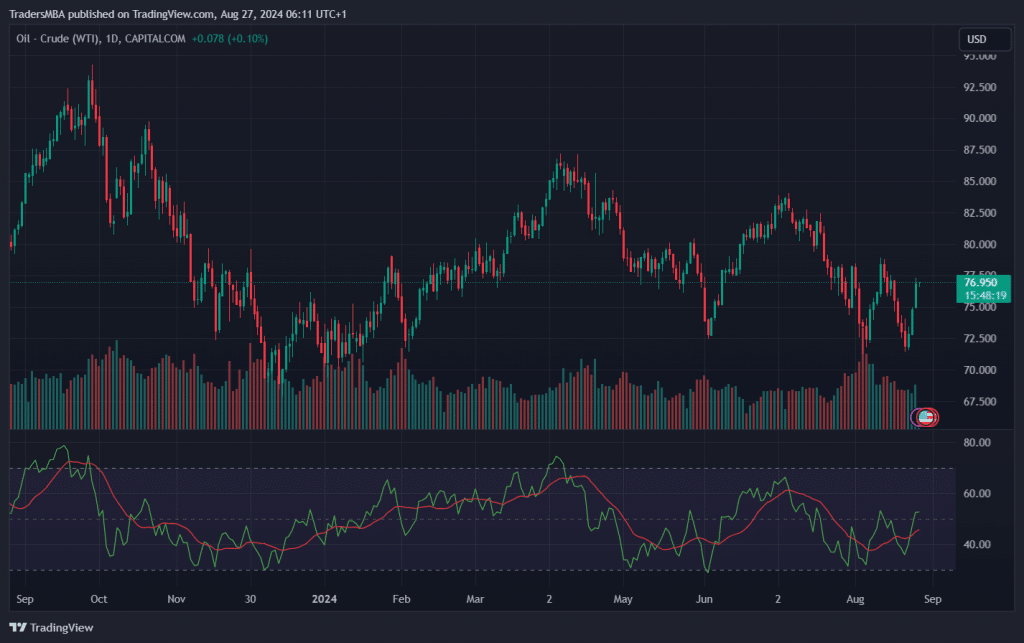
Crude Oil (WTI) is showing bullish momentum as it nears key resistance levels around $77.50. With recent lows holding strong and rising volume supporting the price action, there is potential for further gains towards the $82.50 resistance. Macroeconomic factors, including upcoming inventory data and Federal Reserve decisions, could influence the trend. Sentiment remains cautiously optimistic as traders position for a continued rally.
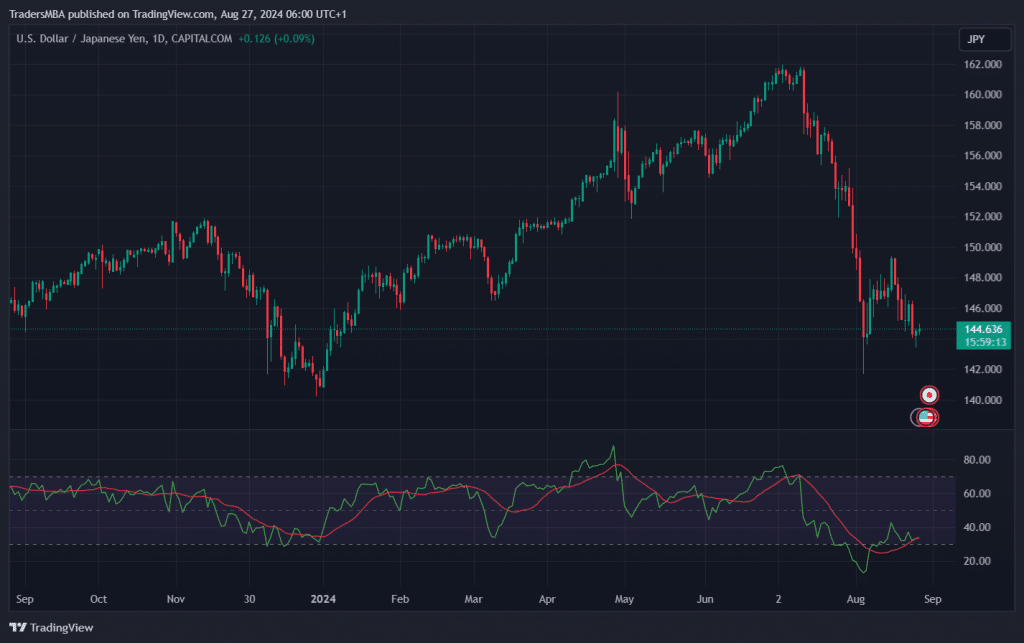
The USD/JPY pair is currently at a critical juncture, showing potential signs of reversal around key support levels. With mixed market sentiment and upcoming macroeconomic events, the pair may either see a bullish recovery towards 148.00 or continue its bearish trend if support at 144.00 is broken. Traders should closely monitor price action and central bank announcements for clearer direction.

Warner Bros. Discovery Inc. (WBD) shows promise as a potential buying opportunity, with bullish price action and favourable RSI indicators suggesting further gains. Investors should keep an eye on macroeconomic events and sector earnings reports, which could impact WBD’s outlook. Key support and resistance levels provide guidance for managing risk and maximizing profit potential.

Day trading stocks to watch can be a thrilling and potentially profitable endeavour. With the right strategies and knowledge, you can identify opportunities that others might miss. Let’s dive deep into the world of day trading and uncover what you need to keep an eye on. Understanding Day Trading Day trading involves buying and selling stocks within the same trading day. Traders seek to capitalise on small price movements in……
Read more

In the modern financial landscape, the concept of “traders that trade for you” is gaining immense popularity. This comprehensive guide delves into everything you need to know about these professional traders. By the end of this article, you’ll have a solid understanding of how they operate, the benefits they offer, and how to choose the right one for your needs. Who Are These Traders? Traders that trade for you are……
Read more

Day trading cryptocurrency has become a popular and potentially lucrative endeavour. However, it’s crucial to understand the intricacies involved to maximise your success. Day trading involves buying and selling cryptocurrencies within the same day to profit from short-term price movements. This article provides a comprehensive guide on the best way to day trade crypto, covering essential steps, strategies, and tips. Understanding the Basics of Day Trading Crypto To begin with,……
Read more