
Stock Index Weighting Explained: Market Cap, Equal and Price
Stock index weighting determines how much influence each constituent’s price movement has on the benchmark’s return. The three widely used approaches are float-adjusted market-capitalisation weighting, equal weighting and price weighting. Their definitions matter because two indices holding identical companies can report very different results from the same market session.
Weighting also affects turnover, sector concentration, the impact of stock splits and sensitivity to the largest constituents. This guide uses clear worked examples and shows why headline index performance should not be interpreted without knowing the methodology.
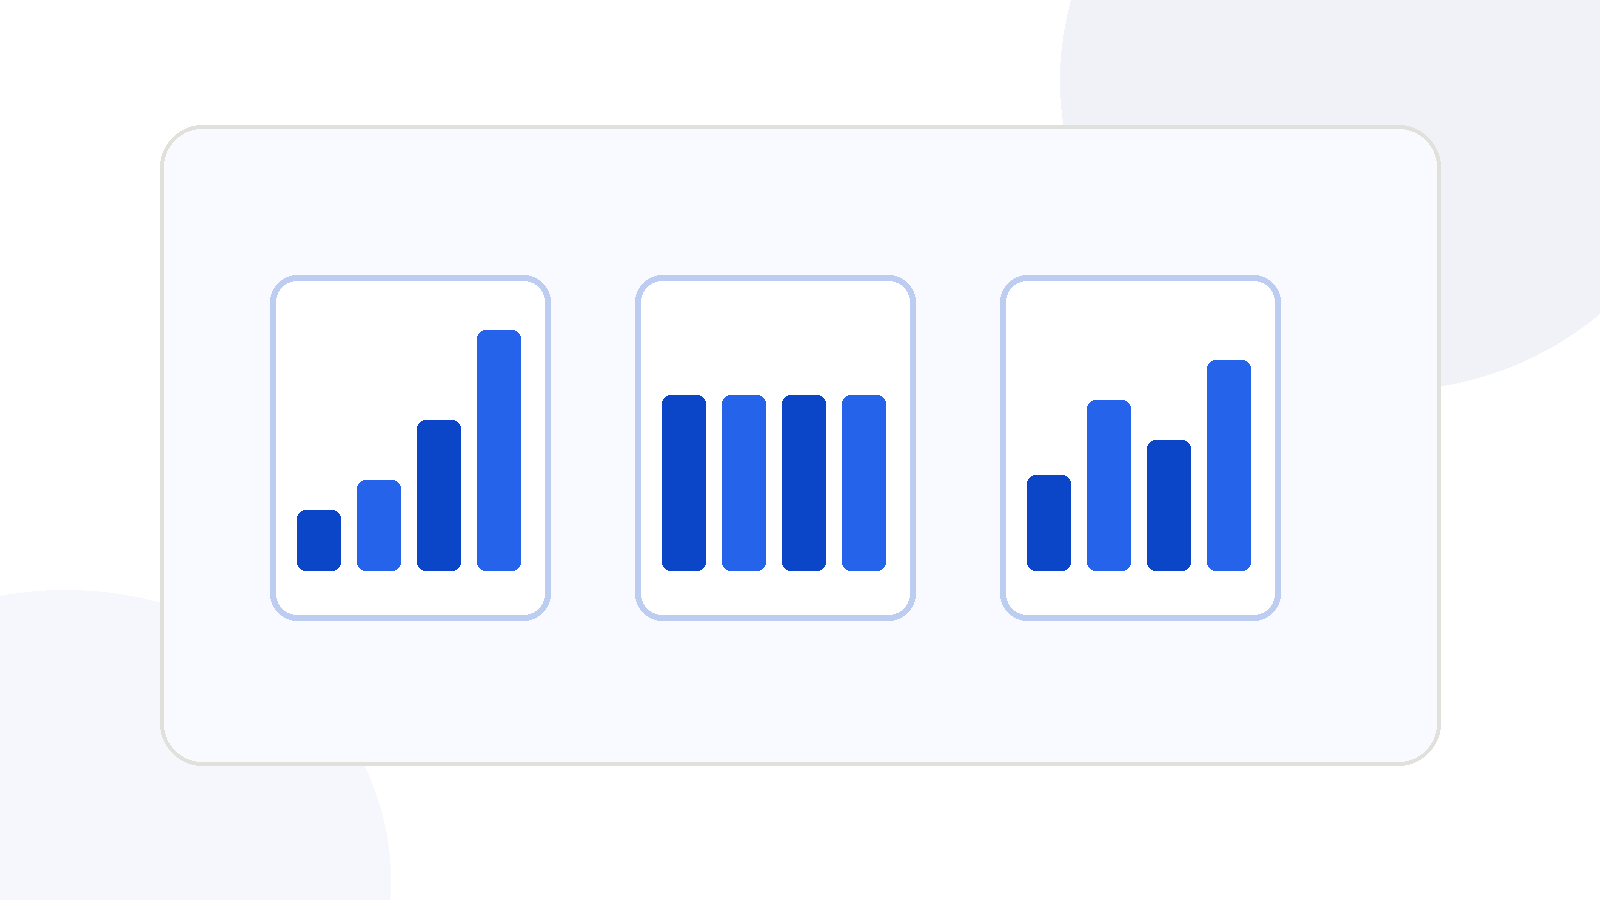
What is an index weight?
An index weight is a constituent’s relative share of the calculated benchmark portfolio under the index’s rules. In a simplified weighted-return calculation, total index return over a short period is approximately the sum of each constituent’s weight multiplied by its return. Real index calculations also account for constituent changes, dividends and corporate actions.
If a stock has 10% weight and rises 5%, its first-order contribution is 0.5 percentage points. Another stock with 1% weight rising 10% contributes 0.1 percentage points. Percentage returns alone therefore do not indicate the size of an index move.
Market-capitalisation weighting
A market-cap-weighted index generally gives more influence to companies with higher eligible share values. Full market capitalisation equals price times the defined number of outstanding shares. Float-adjusted methodologies apply an investability factor to reflect shares available to ordinary public investors.
Suppose a toy index contains Company A with eligible adjusted value £60 billion and Company B with £40 billion. Their weights are 60% and 40%. If A gains 5% and B falls 2%, the approximate benchmark return is 0.6 × 5% + 0.4 × −2% = 2.2%.
Why free float matters
A company’s full market value can overstate how much of its equity is available for public trading if strategic shareholders hold a large share. An index may reduce eligible share counts according to float criteria. This can prevent concentrated-control firms from receiving weights that are difficult to replicate using tradable stock.
For an imaginary company with 200 million shares priced at £10 and a 40% free float, full value is £2 billion but a simple float-adjusted weight basis is £800 million. The real methodology may use bands, foreign ownership adjustments or other rules; verify the exact provider definition.
Equal-weighted indices
An equal-weight index targets the same allocation to each security at specified rebalance dates. A four-stock index would target 25% each after rebalance. As market prices change, those allocations drift until weights are reset. The approach can increase exposure to smaller firms relative to a capitalisation-weighted version.
If four equally weighted stocks change by +8%, +4%, −2% and −6%, the simplified index return is the average: 1%. A market-cap-weighted version using larger weights for the first stock could perform better; one overweight the last stock could perform worse.
Price-weighted indices
Price weighting assigns influence according to nominal share prices, with adjustments for stock splits and replacements. The Dow Jones Industrial Average is a prominent example. A $200 share can receive twice the weight of a $100 share even if the $100-share company has far greater market capitalisation.
This makes corporate stock-price splits particularly important for future index composition. Providers adjust divisors to maintain continuous levels, but relative stock weights can change after a split. Price weighting should not be confused with market-value weighting.
Same stocks, three different weighting outcomes
Consider three fictional stocks: A priced at £100, B at £50 and C at £10, with eligible adjusted market values of £70bn, £20bn and £10bn respectively. Their next-period stock returns are −5%, +10% and +20%.
The market-cap-weighted result is 0.7×−5% + 0.2×10% + 0.1×20% = 0.5%. Equal weight gives (−5% +10% +20%)/3 = 8.33%. The simple price-weighted result uses weights 100/160, 50/160 and 10/160, yielding −3.125% +3.125% +1.25% = 1.25%. Identical stocks, very different indices.
Why concentration develops
In market-cap-weighted indices, companies that outperform tend to become a larger share of the benchmark, other things equal. This can lead to increasing concentration in a few highly valued firms. The index may still have hundreds of constituents, yet its return can be largely determined by a small group.
Equal weighting periodically reduces positions in relative winners and increases positions in relative laggards, introducing a systematic rebalance effect and more turnover. This can outperform or underperform in different trends and volatility environments. No method guarantees lower risk or a higher return.
Sector exposures under alternative weights
A sector containing the largest market-cap stocks may dominate a cap-weighted index while representing a much smaller share under equal weighting. Conversely, sectors with many medium-sized constituents can gain weight in equal-weight versions. Changes in index performance may therefore arise from sector reallocation rather than only stock-selection effects.
For fair comparison, calculate both sector contribution and within-sector company returns. It is misleading to attribute all relative performance between two weighting variants to “better diversification” without measuring changed factor and industry exposure.
Rebalancing and implementation costs
An equal-weight index may rebalance on a scheduled timetable, requiring sales of relative outperformers and purchases of underperformers. That generates turnover and practical tracking costs. Market-cap-weighted portfolios can often require less routine trading for price-driven weight changes, though changes in constituents and float create their own transactions.
An index calculation may assume theoretical transactions that an actual fund must implement with spreads, commissions, stamp duties where relevant, market impact and taxes. Two benchmarks with similar gross back-tested returns can produce different investor net outcomes.
The role of index caps
Some modified market-cap indices impose limits on individual constituent weights or aggregate concentration to meet investability, diversification or regulatory objectives. The Nasdaq-100 uses modified weighting, with significant methodology updates effective May 2026. A capped index may rebalance more aggressively than an uncapped parent benchmark.
Weight caps can change exposure during a strong momentum period. They might reduce concentration risk, but they can also lower returns if the capped leader continues outperforming. The actual effect depends on market outcomes and the implementation rules.
Dividends and return variants
Weighting determines relative constituent influence, while price and total-return variants determine how dividend cash flows affect performance. Equal-weight price return and cap-weight total return cannot be compared directly to infer the effect of weighting alone.
To compare methodologies, hold constant the constituent universe, time period, currency and dividend treatment as far as practical. Then identify the impact of weighting rules and rebalancing. For investment products, subtract actual fees and tracking costs.
Index divisor and corporate actions
Index levels are not obtained simply by adding share prices or market values without maintenance rules. Divisor adjustments prevent mechanical splits, special distributions or constituent replacements from generating spurious performance changes. The exact treatment depends on the index sponsor and type of event.
A two-for-one split alone should not make a shareholder economically wealthier or poorer. Yet without a divisor adjustment, a naïve price average would appear to drop when a high-priced constituent splits. This is why index methodologies contain extensive corporate-action specifications.
Impact of company buybacks
Share repurchases can change a company’s share count and potentially its eligible float or weighting measures. The timing of changes in an index depends on provider methodology and review arrangements. A buyback may also affect earnings per share and company financial strength, so its economic consequences are not limited to index mechanics.
An index weight can shift because price changes, share-count changes or other methodology factors change. It is therefore useful to decompose weight changes rather than assume they reveal only investor buying or selling.
How to compare index risk
Compare concentration in the top ten names, sector weights, historical volatility, drawdowns, liquidity and rebalance turnover. Equal weighting may reduce reliance on a handful of mega caps while increasing smaller-company sensitivity and turnover. Price weighting may create unrelated nominal-price biases. Cap weighting can concentrate in companies that have already appreciated substantially.
Risk should be assessed in relation to the intended purpose. A benchmark may be excellent for measuring the large-cap market segment yet unsuitable for a portfolio seeking broad equal-company exposure.
Why backtests may overstate a weighting advantage
Historical index reconstructions can be affected by survivorship, hindsight in constituent selection, incomplete corporate-action data and underestimated trading expenses. Some strategies appear attractive only because they rebalance at idealised closing prices or ignore taxes and market impact.
A credible comparison includes the provider’s live inception date, period of hypothetical performance, point-in-time constituents and trading assumptions. A weighting scheme that outperformed in one market cycle may behave differently in the next.
A practical methodology comparison checklist
Identify the index’s constituent universe and selection criteria, then its exact weighting rule and any caps. Record the review dates, dividend variant, currency and treatment of corporate actions. Evaluate top-name concentration and sector exposure. If comparing funds, examine replication, turnover, tracking difference and execution costs.
Before selecting a benchmark for research, ask what economic quantity it is intended to represent: total investable market value, average constituent performance or a narrower sector. Different choices are legitimate but answer different questions.
Worked reference table
| Company | Price | Adjusted cap | Period return |
|---|---|---|---|
| A | £100 | £70bn | −5% |
| B | £50 | £20bn | +10% |
| C | £10 | £10bn | +20% |
| Market-cap index | — | 70/20/10 weights | +0.50% |
| Equal weight | — | One-third each | +8.33% |
| Price weight | — | 100/50/10 weights | +1.25% |
Hypothetical identical constituents with different weights; price index uses a simplified starting price ratio.
Why weights drift between index reviews
Equal-weighted indices set target constituent weights at specified rebalance dates. They do not stay exactly equal every trading minute: outperforming stocks become larger and underperformers shrink until the next scheduled reset. A market-cap-weighted benchmark allows market-value movements to change weights naturally but still adjusts for constituent eligibility, shares and corporate events.
The difference creates distinct turnover profiles. Equal weighting generally requires buying relative losers and selling relative winners at a rebalance, while cap weighting can accommodate many price-driven changes without equivalent share transactions. Actual fund implementation costs can differ.
Sector exposure under different weighting schemes
Suppose a sector accounts for 35% of a float-market-cap index but only 15% of its equal-weight counterpart. If the sector rises 10% and every other sector is unchanged, the first index gains approximately 3.5% and the second 1.5%. Their different returns reflect sector exposure, not an inherent guarantee of one strategy’s superiority.
A reliable comparison decomposes between-sector weights and within-sector performance. Otherwise size, valuation, momentum and industry differences can be incorrectly attributed solely to the weighting methodology.
Free float and strategic ownership
A firm can be large by full market capitalisation but have relatively few shares available to ordinary investors. For a fictional company with 200 million shares at £15, full market value is £3 billion. If only 40% counts as eligible float, its simplified weighting value is £1.2 billion.
The other £1.8 billion has not vanished economically: the adjustment is intended to reflect investable availability. Index-specific definitions can include other eligibility and ownership rules, so public float should be obtained from the provider’s methodology rather than inferred from rough media descriptions.
Weight caps and modified market capitalisation
Some benchmark sponsors limit maximum constituent exposure to address concentration or investability concerns. Nasdaq-100 uses modified market capitalisation, with rules updated in May 2026 for low-float securities. Such caps may reduce the influence of a single very large company relative to an uncapped index.
The benefit is contingent. If the constrained company falls sharply, a capped benchmark can experience a smaller drag; if it continues outperforming, the same cap can reduce gains. The risk trade-off must be understood through current weights and scenario analysis rather than assumed.
Why stock splits affect price weighting differently
In a conventional two-for-one split, nominal price roughly halves while shares outstanding double, leaving total company value unchanged mechanically. Float-market-cap indices adjust share data and divisors so the split itself does not create economic return. A price-weighted index must also preserve its index level through appropriate divisor adjustments.
Yet a split can change a price-weighted constituent’s relative influence on future index movements. That is a distinctive structural feature and one reason the Dow’s weighting should not be confused with company size.
Dividend variants and tracking-product costs
Index weighting and return treatment are separate choices. A float-market-cap index can be published in both price and total-return versions, while an equal-weight index can also have alternative dividend conventions. Comparing a gross total-return version of one with the price-only version of another is not a valid test of their weighting methodologies.
For investable outcomes, include fund expenses, actual tracking difference, trading spreads and turnover-related costs. A theoretically attractive historical index need not have been cheaply or reliably replicated by a real investor.
Backtest quality and survivorship bias
Some indices report simulated returns for dates before their actual launch. A backtest may use current knowledge of companies, historical data cleaning and idealised rebalancing prices, making results difficult to reproduce in practice. A study that selects only companies surviving until today can systematically omit failed or poorly performing constituents.
Ask whether membership and data were available at each historical decision date, and whether trading, delisting, taxes and transaction costs were incorporated. Simulated outperformance should not be represented as a guarantee of live strategy performance.
Look-through portfolio concentration
An investor can own several different ETFs while retaining major overlap in the same technology businesses. An S&P 500 fund, a Nasdaq-100 fund and a technology-sector fund can collectively concentrate more capital in a small set of issuers than the number of fund holdings suggests.
Analyse issuer exposure across products, factor sensitivity and currency rather than count ETF tickers. Equal-weight exposure can reduce concentration in a particular group at rebalance, but introduces different sector, size and turnover risks.
Choosing the right weighting for a research question
Float-market-cap weighting helps represent the value of the investable market; equal weighting highlights a more uniform constituent basket; price weighting captures an established historical methodology with nominal-share-price effects. None is universally best for every investment or analytical objective.
State what the benchmark is intended to measure and examine current constituents, concentration, turnover and implementation costs. A weighting strategy that performed well during one economic cycle may behave very differently when relative sector leadership changes.
Frequently asked questions
Which weighting method is the most diversified?
It depends on the definition of diversification. Equal weighting reduces top-name concentration but can increase smaller-stock and turnover risks.
Does a high stock price mean a company is larger?
No. Company market value also depends on shares outstanding.
Does market-cap weighting automatically buy more expensive shares?
Weights drift with market values; rebalancing mechanics differ from a discretionary strategy of buying shares because their prices increased.
Why is the Dow unusual?
It uses price weighting rather than float-adjusted market-cap weighting.
Can two indices with the same stocks move differently?
Yes. Their constituent weights and rebalancing rules can produce substantially different performance.
Related Stock Indices Education
Explore stock market index basics, the S&P 500, Nasdaq-100 and the Atravix six-pillar framework.
Sources and further reading
- S&P Dow Jones — Methodology Matters
- S&P Dow Jones — S&P US Indices
- S&P Dow Jones — Dow Jones Methodology
Important notice: This is financial education, not a recommendation or personalised investment advice. All calculations are hypothetical unless stated. Indices and their tracking products are exposed to share-price, currency, liquidity and other risks.