
How Financial Market Prices Are Formed: Supply, Demand and Expectations
Financial market prices emerge from the interaction of supply, demand, expectations and executable trading conditions. The current market price is set at the margin by participants willing to transact, while underlying valuation depends on future cash flows, required returns and risk. This distinction explains why prices can change quickly even when only a small fraction of an asset’s total supply trades.
Price discovery is not limited to a textbook supply-and-demand graph. Actual markets use order books, dealers, auctions and over-the-counter negotiation, with varying liquidity and transparency. The following guide connects valuation theory to practical bids, offers, information surprises and execution costs.
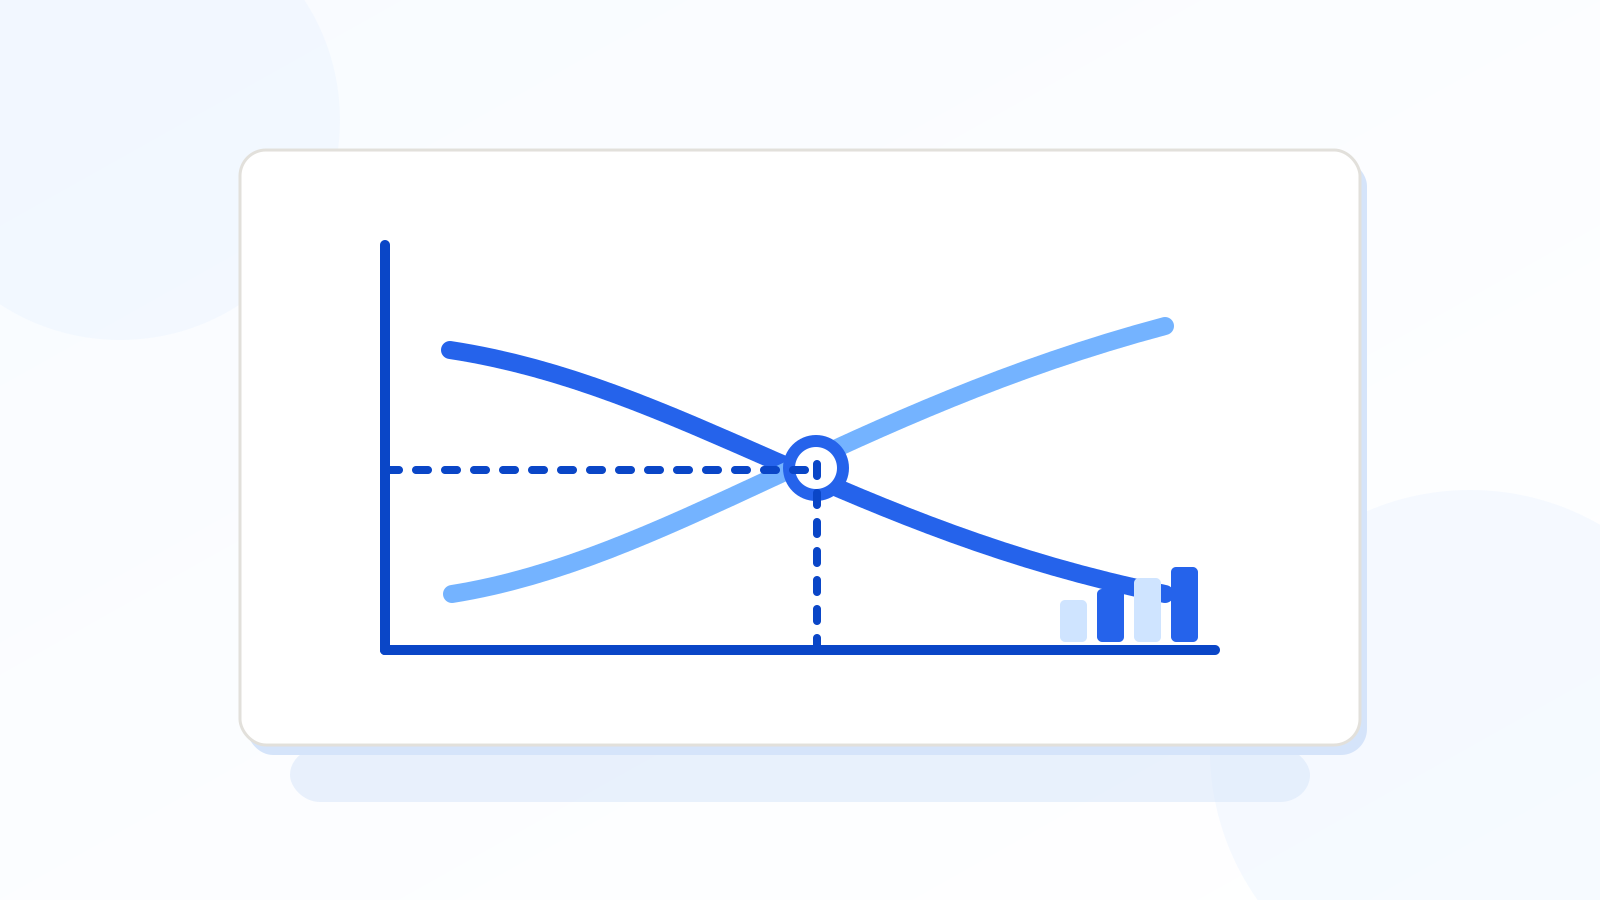
What is price discovery?
Price discovery is the process by which trading, quotes and expectations establish a price for an asset. Investors estimate future cash flows, risk and alternative opportunities, while brokers, dealers and exchanges organise transactions. The observed price is the outcome of participants willing and able to trade under current conditions, not a permanent objective assessment of economic value.
Prices can move quickly when information changes or when liquidity disappears. A market does not require every holder to trade for its displayed valuation to change: one completed transaction or a revised bid and ask can affect the reference price used to value many outstanding units.
Supply and demand in a financial market
At a given moment, potential buyers offer to acquire an asset at selected prices, while potential sellers demand prices at which they are willing to part with it. When additional buyers become willing to pay more or sellers require less compensation to sell, the balance changes. The resulting price reflects the trading mechanism and actual orders.
The familiar supply-and-demand diagram is an educational simplification. Real order books contain discrete prices and quantities, and not every participant submits a visible order. Quotes can also be cancelled. Markets with dealer negotiation or OTC trading use different mechanisms from a continuous exchange order book.
Marginal buyers and sellers
The marginal buyer and seller are the counterparties prepared to transact at the current clearing price. Their price-setting role can be disproportionate to the total number of investors who continue to hold existing positions. A company can have millions of outstanding shares while only a fraction trade during a particular minute.
For example, if a small trade occurs at £20 instead of £19, market capitalisation calculated using the last price increases across the estimated share count. This does not mean enough cash has entered the market to purchase every share at £20. It is a valuation convention based on a marginal price.
Bid, ask and the last trade
The bid is a quoted price at which someone is willing to buy a specified quantity; the ask or offer is a price to sell. A trade can occur at the best bid, best ask, in between or through other execution mechanisms under the venue rules. The last traded price may become stale, especially in thin securities.
A bid of £49.90 and ask of £50.10 gives a midpoint of £50.00 and a £0.20 spread. Buying immediately at the ask is not the same as purchasing at the midpoint. Trading fees and market impact can add further cost. See Market Liquidity Explained.
Order books and available liquidity
A displayed order book lists selected resting buy and sell orders, usually aggregated at price levels. A market order may consume the best quote and then move through deeper levels if its size is larger than the available top-of-book liquidity. This can produce an average execution price worse than expected.
Order books change rapidly as traders revise or cancel quotes. Some venues also use hidden liquidity, auctions or specialist order types. A static image of depth is not a guarantee that the quoted quantities will remain available when an order arrives.
Worked example: a new demand shock
Suppose a fictional company’s share trades around £25 before it unexpectedly announces stronger projected earnings. Buyers reassess value and offer higher prices, but sellers willing to transact at £25 may disappear. The next executable trades can occur at £26 or £27 even though the economic event affected the firm’s expectations rather than its issued share count.
The price jump is not evidence that a precise amount of cash must have entered the market. The change reflects the new level at which marginal supply meets demand. A gap is especially likely when trading resumes after news during a market closure.
Expectations versus published facts
Financial markets discount expected future conditions, so an event can be objectively positive yet disappoint investors. If a company reports 12% revenue growth when market expectations were 18%, its price may fall despite a headline describing record sales. Conversely, weak earnings can coincide with a rally if investors feared much worse results.
To interpret price response, compare the actual release with the relevant prior expectation and the risk premium already embedded in price. Merely describing the news as good or bad is incomplete. Forward guidance and the perceived durability of results matter alongside historical data.
Why valuation multiples change
Equity prices can be analysed as expected future benefits discounted for time and risk. A company earning more money can still lose market value if investors demand a higher return or become less confident about future growth. The price-to-earnings multiple is one simplified expression of valuation expectations.
Suppose hypothetical annual earnings per share rise from £4 to £4.20, a 5% improvement, while the valuation multiple falls from 20× to 17×. The price changes from £80 to £71.40, a decline of 10.75%. This illustrates why earnings growth does not guarantee share appreciation.
Bond prices and discount rates
Bond pricing uses the same principle of present value but usually with defined contractual payments. If required yields rise and promised fixed payments remain unchanged, price generally falls. The yield increase may reflect changing government interest rates, credit spreads or liquidity compensation, so the economic explanation needs to be identified.
A simple one-year payment of £105 is worth £100 at a 5% annual discount rate. At 7%, the same payment is worth about £98.13. No company profit forecast is required for that mechanical result, but credit quality affects whether the £105 will actually be paid. See Bond Prices and Yields Explained.
Currency pricing and relative value
Foreign exchange rates describe the value of one currency relative to another, so every directional statement has two sides. A stronger US dollar against sterling means fewer dollars may be required to buy a pound, all else equal. Interest-rate expectations, cross-border funding and risk perceptions influence the rate, but outcomes depend on the specific pair.
Currency markets have substantial OTC activity and multiple instruments, including spot, forwards and swaps. A forward quotation also incorporates financing and settlement conventions; it should not be treated as a simple forecast of the future spot rate.
Commodity prices and physical constraints
In commodity markets, supply and demand include production capacity, inventories, storage, transport and delivery conditions. An unexpected mine outage can affect metal prices; weather and crop yields matter for agricultural products; oil logistics and refinery demand can affect energy spreads.
Spot and futures prices can differ because contracts have expiry and delivery terms. A nearby oil contract may react sharply to storage limitations, while a later expiry responds differently. The asset’s physical properties matter to the financial price-discovery process.
Information surprises versus positioning
A widely anticipated announcement may move prices little because market participants have adjusted positions beforehand. A smaller but unexpected change can provoke a large response. The initial direction also depends on which participants are positioned for the event and how many are forced to adjust afterward.
Positions are not always visible. Observed futures volume, fund flows and options interest can offer partial clues, but they do not identify every investor’s motives. A sharp rise after negative news can reflect short covering or a lower risk premium rather than a suddenly improved fundamental outlook.
Why prices can move without new headlines
Price changes also arise from rebalancing, hedging, redemption requests, inventory constraints, collateral calls and trading algorithms. A fund facing client withdrawals may sell assets for cash regardless of its view of long-term fair value. Market makers can reduce inventory after volatility increases.
These flows alter the available balance of buyers and sellers. Describing every intraday price move as a response to a macroeconomic headline can therefore be misleading. Good analysis keeps fundamental explanations separate from known or suspected market-structure effects.
Volume is not the same as price pressure
Trading volume counts executed transactions under the relevant definition, whereas price changes depend on what marginal participants are willing to pay and what liquidity is available. Very high volume can accompany a relatively unchanged price when buyers and sellers exchange many shares near an equilibrium. Conversely, a thin market can move sharply on little volume.
Volume data can also be fragmented across venues, delayed or expressed in inconsistent units. Compare like with like before inferring that higher reported turnover proves stronger investor conviction.
Volatility and uncertainty
Volatility describes variability in observed prices or returns. It can increase when expectations change rapidly, liquidity worsens or leverage forces transactions. Volatility is not a direct measure of whether an investment is overvalued, and high volatility does not itself predict whether prices will rise or fall.
Historical volatility uses past price changes, while option-implied volatility reflects prices of options under a model. The two can differ. Market commentary should state which definition is being used and the observation horizon.
Liquidity shocks and market impact
A security with wide bid–ask spreads or shallow depth may require a substantial price concession to execute a large sell order. During stress, liquidity providers may withdraw quotes, causing a downward gap even when expected cash flows have not changed proportionally. This creates a feedback loop if falling prices trigger margin calls or risk limits.
One cannot assume that a stop order will achieve its selected trigger price. A marketable stop may execute at the best prices available after a gap, potentially much worse than the initial level. Execution mechanics are part of price formation, not an administrative afterthought.
Market efficiency and its limits
Widely traded assets often respond quickly to public news, making simple predictable mispricings difficult to exploit after transaction costs. But market efficiency is not a claim that every price is correct or that speculative excess and forced selling never happen.
Information can be incomplete, interpretations can vary, and different investors face different financing and liquidity constraints. A researcher proposing mispricing needs to identify a credible reason why the expected future price differs from the current executable price, not merely say an asset seems “cheap”.
How cross-asset prices react to one shock
A rise in inflation expectations can pressure long-duration nominal bonds, change equity discount rates, affect currency interest-rate differentials and influence commodities. However, the direction depends on whether the inflation originates from supply constraints, stronger demand or another source. A policy response can alter the original effect.
That is why broad fixed rules such as “higher oil always means higher inflation and lower stocks” are unreliable. Cross-asset research identifies the shock, the market’s prior expectations and the transmission mechanisms. Read Risk-On vs Risk-Off.
A practical price-discovery research checklist
First identify the exact instrument and quoted venue. Record the bid, ask, last trade, size and timestamp. Compare the new information with prior consensus or market pricing. Evaluate whether the valuation mechanism involves earnings, coupons, currency differentials or physical supply.
Then assess liquidity and potential forced flows. Separate what is observable—price, volume, quotes and disclosed events—from explanations that remain hypotheses. State what future evidence would confirm or contradict the interpretation rather than treating one price move as proof.
Worked example: a two-sided order book
Assume a hypothetical share is quoted at a £20.00 bid for 100 shares and a £20.10 ask for 100 shares, with another 400 shares offered at £20.30. A buyer using a marketable order for 500 shares would pay £2,010 for the first 100 and £8,120 for the next 400, a total of £10,130. Average price is £20.26, not the £20.10 best ask.
This example excludes commissions, cancellations and changes in order flow. It shows how marginal quote levels and available depth determine execution. The reported price may change after the transaction because the best displayed offers have been consumed.
Worked order-book pricing table
| Illustrative order level | Available shares | Ask price |
|---|---|---|
| Best offer | 100 | £20.10 |
| Second offer | 400 | £20.30 |
| Total marketable purchase | 500 | £20.26 average |
Order-book scenario assumes all displayed quotes remain executable; total cost £10,130 before fees.
Why futures and cash-market prices can differ
A stock-index future and the corresponding cash index are related but distinct prices. Futures reflect financing, expected dividends and the time remaining until settlement or expiry under applicable conventions. A futures premium to the cash index is therefore not automatically evidence that traders expect the index to rise by that premium.
Similarly, a commodity futures contract includes an expiry and delivery structure, so its price can differ from the immediate physical spot price due to inventory, storage and financing economics. Comparing instruments without aligning contract terms can create an apparent mispricing that disappears once the specifications are considered.
What happens when buyers and sellers disagree sharply?
Markets can experience a wider gap between desired purchase and sale prices when uncertainty rises. Dealers may quote cautiously, visible depth can shrink and transactions may occur only after substantial price adjustments. The absence of a trade at an old price does not mean the old valuation remains economically available.
For example, if a firm issues a disappointing earnings warning when the exchange is closed, sell orders may accumulate before the next session while few buyers remain willing to bid near the previous close. The opening auction can establish a new price well below the earlier level. The gap reflects revised marginal demand, not a requirement that every existing holder sold their shares.
Frequently asked questions
Do buyers always outnumber sellers when prices rise?
No. Every matched trade has counterparties; price rises when buyers are willing to transact at higher levels than the previously available supply.
Can a stock fall after good earnings?
Yes. Results may fall short of expectations, valuation multiples may decline or liquidity conditions may change.
Is the last trade the price available for a large transaction?
Not necessarily. Order size, depth and market movement determine actual execution.
Does heavy volume guarantee an uptrend?
No. Large two-sided activity can occur with little net price change and is not a directional guarantee.
Can bond and share prices fall together?
Yes. Higher discount rates, liquidity stress or certain inflation shocks can pressure both under particular regimes.
Related Financial Markets Education
Explore market depth and slippage, participants and market makers, and interest rates and asset valuations.
Sources and further reading
- Bank of England — Financial Market Pricing
- SEC Investor.gov — Investing Basics
- Bank of England — Asset Prices and Monetary Transmission
Important notice: General financial education, not personal trading advice. Examples are hypothetical and assume simplified quotations. Prices and liquidity can change without notice; execution and leveraged positions can produce substantial losses.