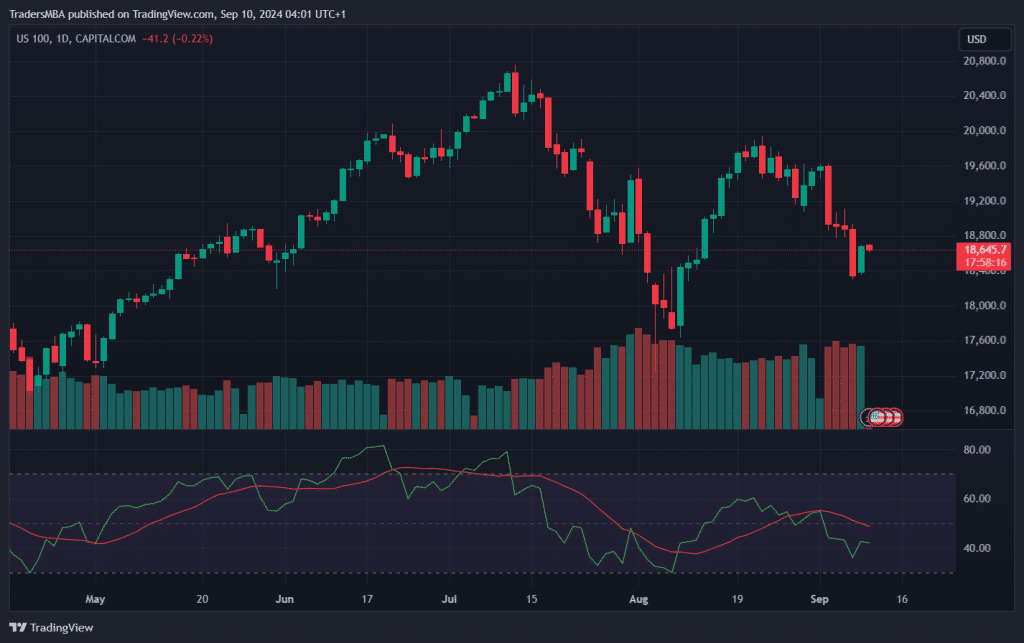
The NASDAQ 100 is showing clear signs of a bearish reversal, with key support levels at 17,600 and resistance at 19,200. Fundamental analysis points to rising economic risks, while technical indicators like RSI and candlestick patterns suggest more downside is likely. The current market setup offers a solid short-selling opportunity, targeting the 17,600 support level.

The Japan 225 has recently experienced a steep drop, with strong bearish signals emerging from both technical and fundamental perspectives. With the RSI edging closer to oversold territory and volume confirming the current downtrend, traders should brace for further downside unless macroeconomic data surprises to the upside. Upcoming earnings from major Japanese corporations and the BOJ’s monetary policy stance are critical factors that could influence the Nikkei’s direction in the near term.
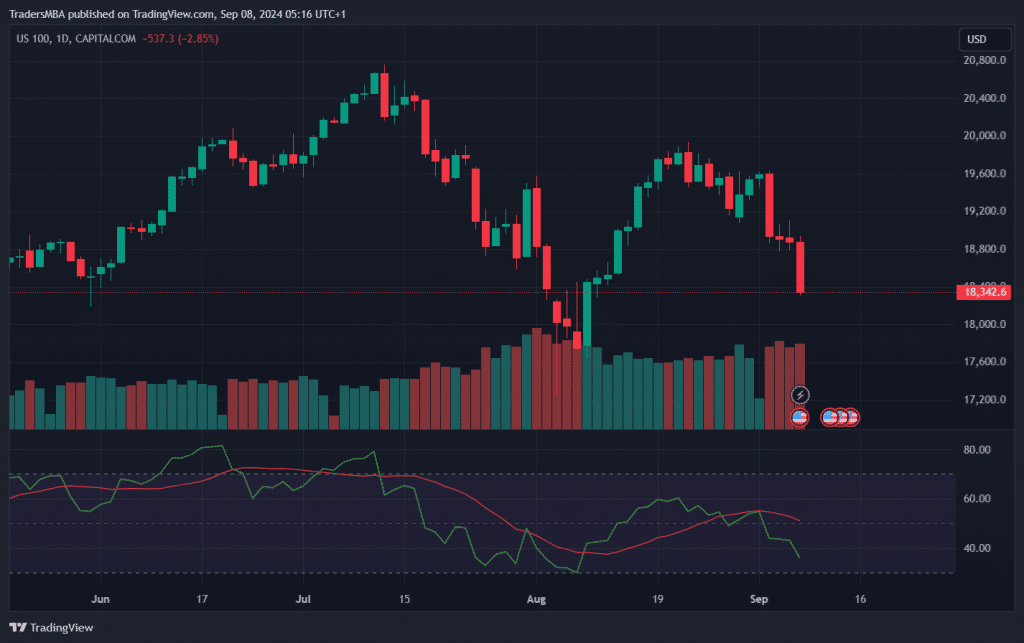
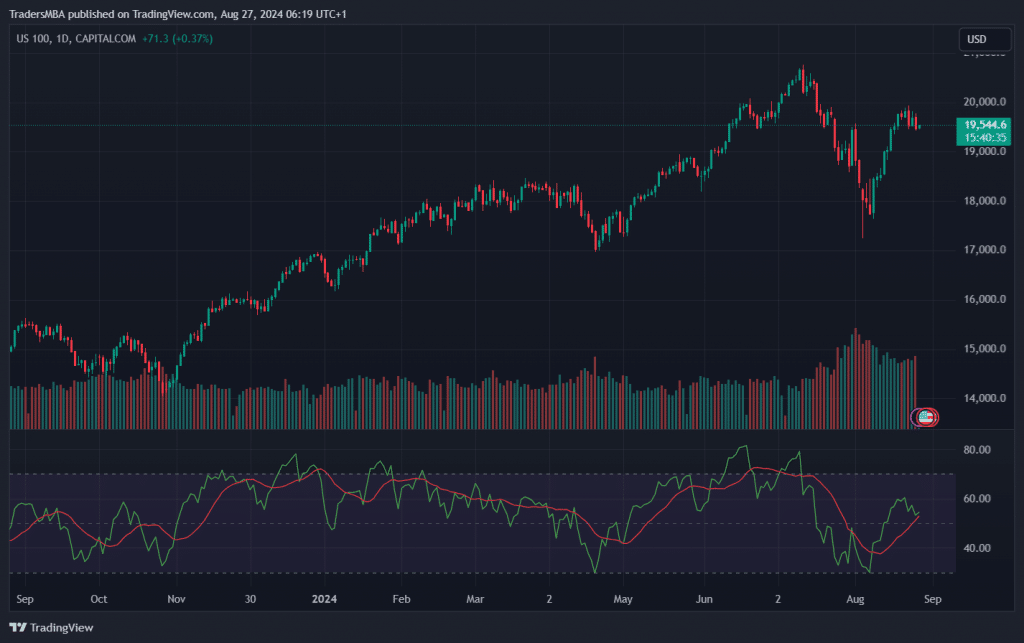
The US 100 has faced increased selling pressure, breaking key support levels as market sentiment turns bearish. Upcoming macroeconomic data and tech sector earnings will likely drive further volatility. Despite oversold conditions, bearish momentum remains dominant, with potential for further declines toward the 17,600 support level.

The US 100 index is at a critical support level, with bearish sentiment dominating the market. Key economic data releases and earnings reports in the coming weeks could further influence its trajectory. Current technical indicators suggest a potential continuation of the downtrend, making a short trade a viable strategy. Traders should closely monitor upcoming macroeconomic and earnings data to navigate the expected volatility.

The US100 index is navigating a critical phase, with technical indicators pointing towards potential bullish momentum. However, upcoming macroeconomic data releases and Federal Reserve policy decisions could introduce significant volatility. Traders are advised to maintain a cautious stance, keeping an eye on support and resistance levels for clear trading signals.

The FTSE 100 Index shows strong bullish momentum as it closes out August, driven by positive technical indicators and increased volume during recent rallies. While sentiment is optimistic, upcoming macroeconomic data and corporate earnings reports will play a pivotal role in determining the index’s next move. Caution is advised due to the current overbought RSI level, indicating a possible short-term pullback or consolidation.

The Nasdaq 100 index shows signs of potential recovery following a recent pullback, with technical indicators aligning for a bullish outlook. Key support and resistance levels provide a framework for traders, while the RSI and volume trends suggest cautious optimism. Market participants should watch upcoming macroeconomic data and earnings releases, which could significantly impact the index’s direction.
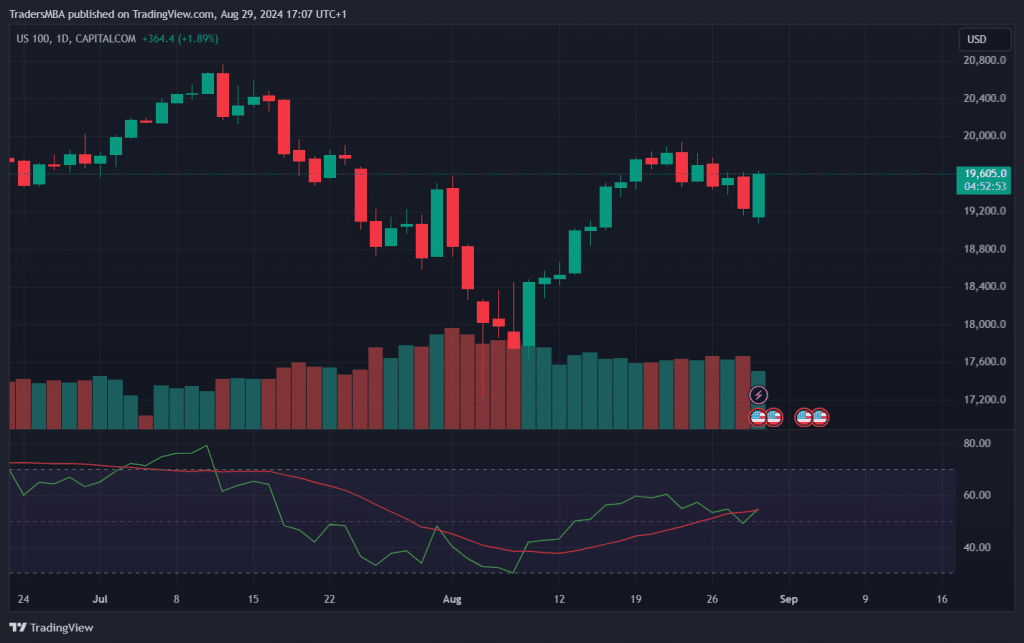
Recent analysis of the Nasdaq 100 indicates a potential bullish reversal, driven by positive price action, rising RSI, and increased trading volume. With key economic data releases and earnings reports on the horizon, traders should remain vigilant, as these events could significantly influence market direction. Cautious optimism is warranted, considering the neutral sentiment and the upcoming Federal Reserve meeting.
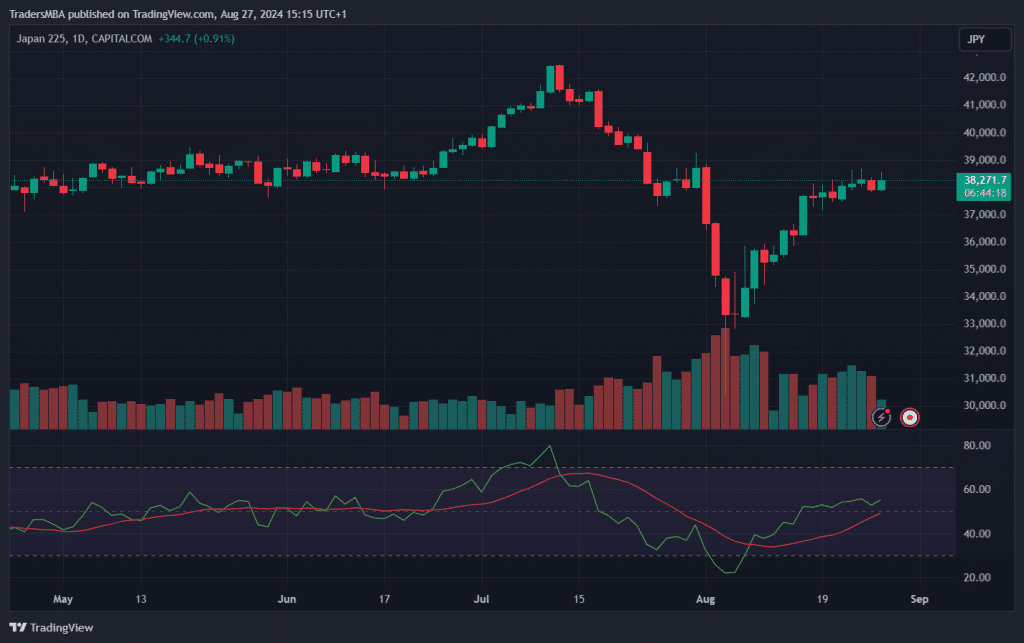
The Japan 225 index is exhibiting signs of potential bullish momentum, with RSI levels indicating further upside potential and volume supporting recent price rebounds. Key economic data and upcoming earnings reports could provide catalysts for movement, especially as the market watches for any shifts in Bank of Japan policy.
The US 100 Index is currently showing strong bullish momentum supported by rising volume and positive sentiment around upcoming earnings and macroeconomic data. Technical indicators suggest further upside potential, with resistance levels around 20,000 and 21,000 in focus. Traders should monitor economic data releases and Federal Reserve announcements closely, as they could impact market direction.