S&P 500 Outlook: Key Signals and What to Expect Next

Introduction
The S&P 500 Index remains a critical benchmark for assessing the strength of the US economy and global market sentiment. As of February 13, 2025, the index is trading at 6,037.88, reflecting a modest increase from the previous session. This analysis offers a detailed review of the S&P 500’s current state, combining fundamental, technical, and sentiment perspectives. With bullish signals in the medium term but signs of consolidation, understanding these dynamics is essential for making well-informed trading decisions.
Fundamental Analysis
The S&P 500’s performance continues to be shaped by strong corporate earnings and a supportive macroeconomic environment, although valuation risks persist in relation to the S&P 500’s current levels.
- Inflation: The Consumer Price Index (CPI) for January shows a 0.3% month-over-month increase, with a year-over-year gain of 2.9%, indicating manageable inflationary pressures. This aligns with expectations and justifies the Federal Reserve’s decision to maintain its current interest rate.
- Monetary Policy: The Federal Reserve remains patient, focusing on preserving growth while managing inflation. This stance provides stability for equity markets, which have responded favourably.
Corporate Earnings
Earnings from key sectors, particularly technology, have exceeded forecasts. Microsoft, for instance, reported adjusted earnings per share of $3.23, surpassing the expected $3.15, contributing to the bullish sentiment surrounding the S&P 500.
Valuation Concerns
Despite strong earnings, the forward price-to-earnings ratio for the index remains elevated at 30x, especially among large-cap technology stocks. This level raises concerns about the sustainability of the rally and leaves the market vulnerable to corrections.
Technical Analysis
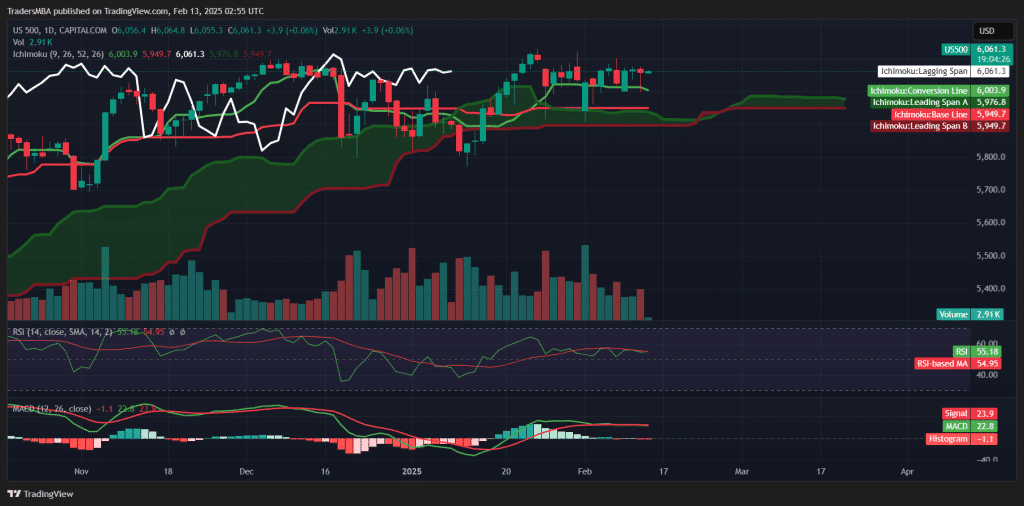
The daily chart for the S&P 500 indicates a neutral to slightly bullish outlook with a few cautionary signs.
Ichimoku Cloud Analysis
- The price is trading above the Kumo (Cloud), signalling a bullish medium-term trend.
- The Conversion Line (Tenkan-Sen) at 6,003.9 is above the Base Line (Kijun-Sen) at 5,949.7, reinforcing short-term bullish momentum. However, the close proximity of the price to the Tenkan-Sen suggests a potential consolidation period.
- The Lagging Span (Chikou Span) remains above both the price and the Kumo, confirming sustained bullish momentum.
RSI (Relative Strength Index)
- The RSI stands at 55.18, reflecting a neutral position. The market is neither overbought nor oversold, leaving room for further upside in the S&P 500.
MACD (Moving Average Convergence Divergence)
- The MACD histogram is at -1.1, with a recent bearish crossover. This indicates weakening bullish momentum and raises the likelihood of short-term consolidation.
Volume Analysis
- Low recent volume indicates limited participation from traders, suggesting that the current move of the S&P 500 may not be sustainable without a stronger catalyst.
Sentiment Analysis
Market sentiment remains cautiously optimistic, but warning signs are beginning to emerge.
Volatility and Market Breadth
The Volatility Index (VIX) has seen a slight increase, signalling rising caution among investors. Moreover, the market’s recent gains have been heavily concentrated in a few large-cap technology stocks, raising concerns about market breadth. Narrow breadth can leave the broader index vulnerable if those leading stocks falter.
Analyst Outlooks
- Goldman Sachs predicts that S&P 500 returns will average just 3% annually over the next decade due to elevated valuations and inflation risks.
- Bank of America, however, projects the index will reach 6,666 points by the end of 2025, driven by steady economic growth and corporate earnings expansion.
While sentiment is generally positive, these factors suggest traders should exercise caution and closely monitor key support and resistance levels within the S&P 500.
Conclusion
The S&P 500 is at a crucial turning point, balancing between bullish medium-term indicators and potential short-term consolidation.
- Ichimoku Cloud and Lagging Span suggest continued bullish momentum, but MACD and low volume indicate caution in the near term.
- Strong corporate earnings and stable monetary policy provide a favourable backdrop, but elevated valuations remain a key risk.
A decisive break above 6,100 would signal a continuation of the bullish trend, while a drop below 5,950 could trigger a deeper correction, impacting the S&P 500. Staying diversified and vigilant is essential in this environment.
Looking to sharpen your trading skills? Join our latest trading courses at Traders MBA and take your market expertise to the next level!

