Forex Trading Trendline Strategy PDF
If you’re searching for a forex trading trendline strategy PDF, chances are you want a clear, actionable method to trade using trendlines. While PDFs can offer a static overview, mastering trendline trading requires live application, visual pattern recognition, and disciplined execution. This article breaks down the core of trendline strategies, shows you how to apply them step by step, and offers a more reliable learning path than any downloadable PDF alone.
What This Article Covers
- The fundamentals of trading forex with trendlines
- Step-by-step guide to drawing and using trendlines correctly
- Buy/sell strategy examples using trendline breaks and bounces
- Common mistakes traders make with trendlines
- A real-world case study based on structured mentoring
- Frequently asked questions
Key Takeaways
- Trendlines are one of the most powerful price action tools in forex trading
- Proper placement is essential - connect swing lows in an uptrend, swing highs in a downtrend
- Strategies include trading bounces, breakouts, and retests
- A PDF alone can’t replace live chart examples and real-time feedback
- Combining trendlines with confirmation tools like RSI or Ichimoku enhances success
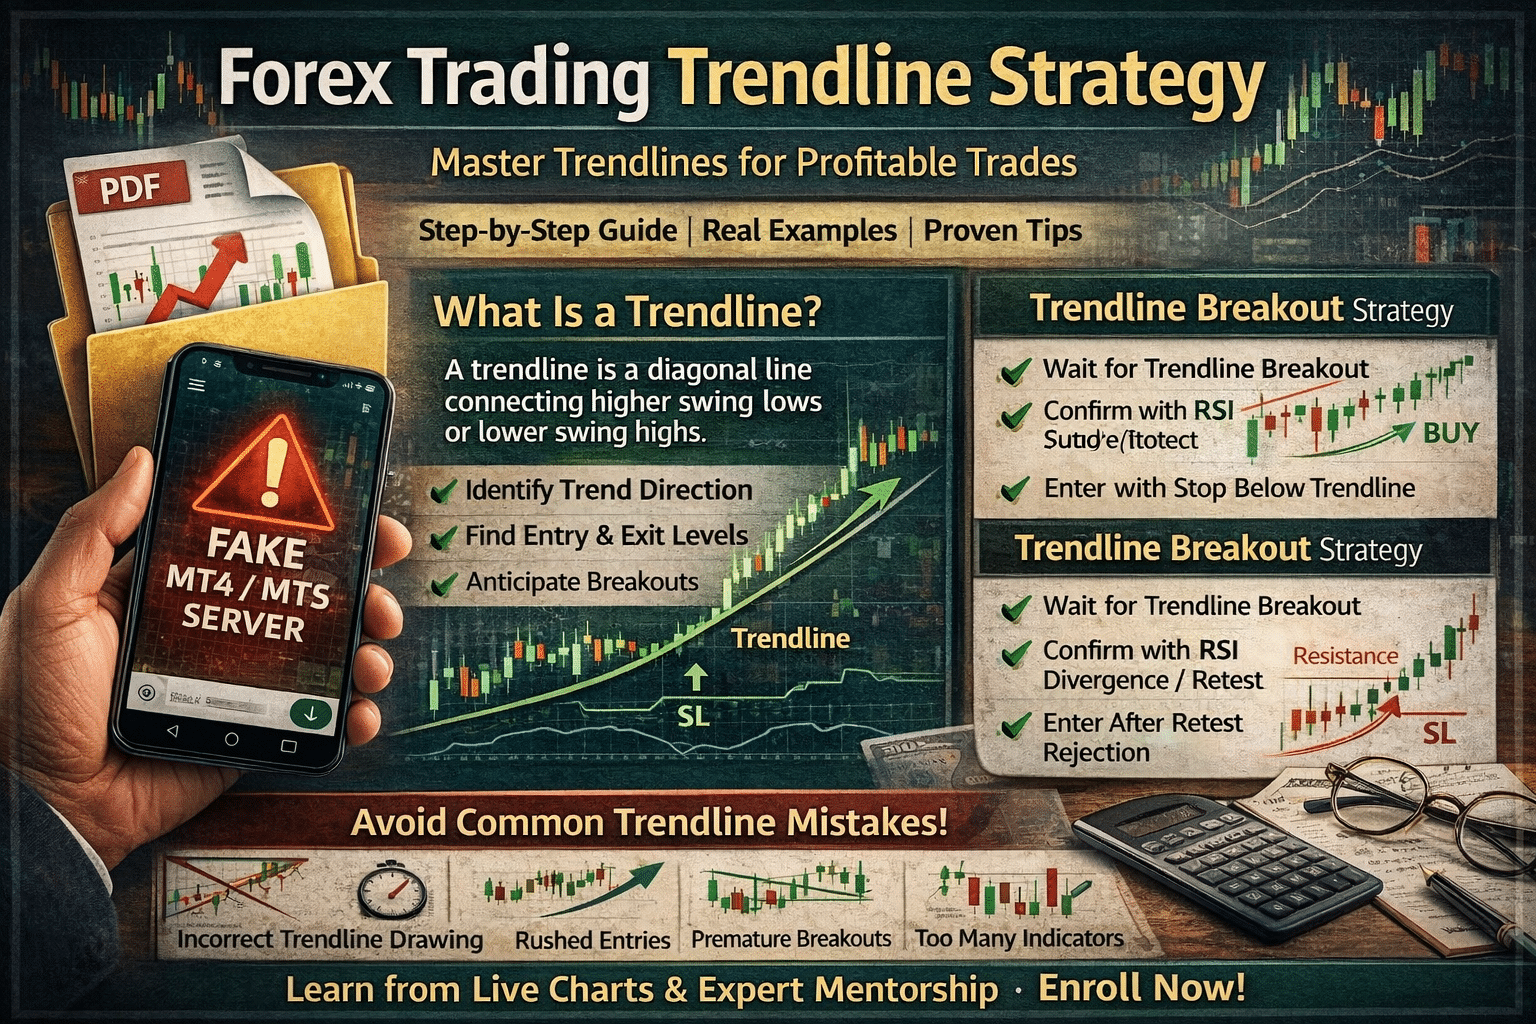
What Is a Forex Trendline?
A trendline is a diagonal line drawn on a chart to connect higher lows in an uptrend or lower highs in a downtrend. It visually represents the direction of the market and acts as dynamic support or resistance.
Correctly drawn trendlines help traders:
- Identify trend direction
- Pinpoint entry and exit levels
- Anticipate breakouts or reversals
How to Draw a Trendline Step by Step
- Identify swing points on the chart (peaks and valleys)
- In an uptrend, connect at least two higher lows
- In a downtrend, connect at least two lower highs
- Extend the trendline into the future
- Use a higher timeframe (H4 or Daily) for more reliability
Forex Trendline Strategy Explained
1. Trendline Bounce Strategy
- Wait for price to approach the trendline
- Confirm with a bullish candlestick (e.g., pin bar, engulfing) in uptrend
- Use RSI (above 50) for confirmation
- Enter on bounce with stop-loss just below the trendline
2. Trendline Break Strategy
- Wait for price to break clearly below or above the trendline
- Confirm with volume or RSI divergence
- Wait for a retest of the trendline as resistance or support
- Enter on retest rejection
3. Dynamic Risk Management
- Always place stop-loss on the opposite side of the trendline
- Use ATR or recent swing high/low to calculate distance
- Aim for minimum 1.5:1 reward-to-risk ratio
Common Mistakes With Trendlines
- Drawing trendlines through candles instead of wicks
- Forcing lines that don’t align with valid swing points
- Trading breakouts before confirmation
- Ignoring higher timeframe trend direction
- Overloading with conflicting indicators
Case Study: From PDF Downloads to Live Trading
A trader from Nairobi spent six months downloading every forex trading trendline strategy PDF they could find. Despite applying the methods, they experienced inconsistent results due to poor placement, rushed entries, and lack of risk management.
They enrolled in the CPD Accredited Mini MBA in Forex Trading at Traders MBA. Through live mentorship, they learned to combine trendline bounces with Ichimoku confirmation and weekly economic events. After just four weeks, they recorded three successful trades using EUR/USD and GBP/JPY based on accurate trendline breaks with volume and RSI confluence.
Frequently Asked Questions
Do trendline strategies work in all markets?
They work best in trending conditions. In choppy or ranging markets, trendlines can give false signals.
How many points do I need to draw a valid trendline?
At least two, ideally three. The more touches without a break, the stronger the trendline.
Can I use trendlines alone for trading?
Yes, but combining them with confirmation tools like RSI or Ichimoku increases reliability.
Are free PDFs a good way to learn trendline trading?
They help with basics, but lack live chart examples, real-time feedback, and risk management guidance.
What timeframe is best for trendline strategies?
H1, H4, and Daily are ideal for cleaner trend structures and stronger signals.
Conclusion
While a forex trading trendline strategy PDF can give you a starting point, true success comes from live application, clear rules, and strategy refinement. Trendlines remain a cornerstone of price action trading - when drawn and applied correctly, they offer consistent and high-probability setups.
To go beyond static downloads and learn trendline strategies with expert mentorship and live market examples, enrol in the Forex Course and master the art of price action with precision.